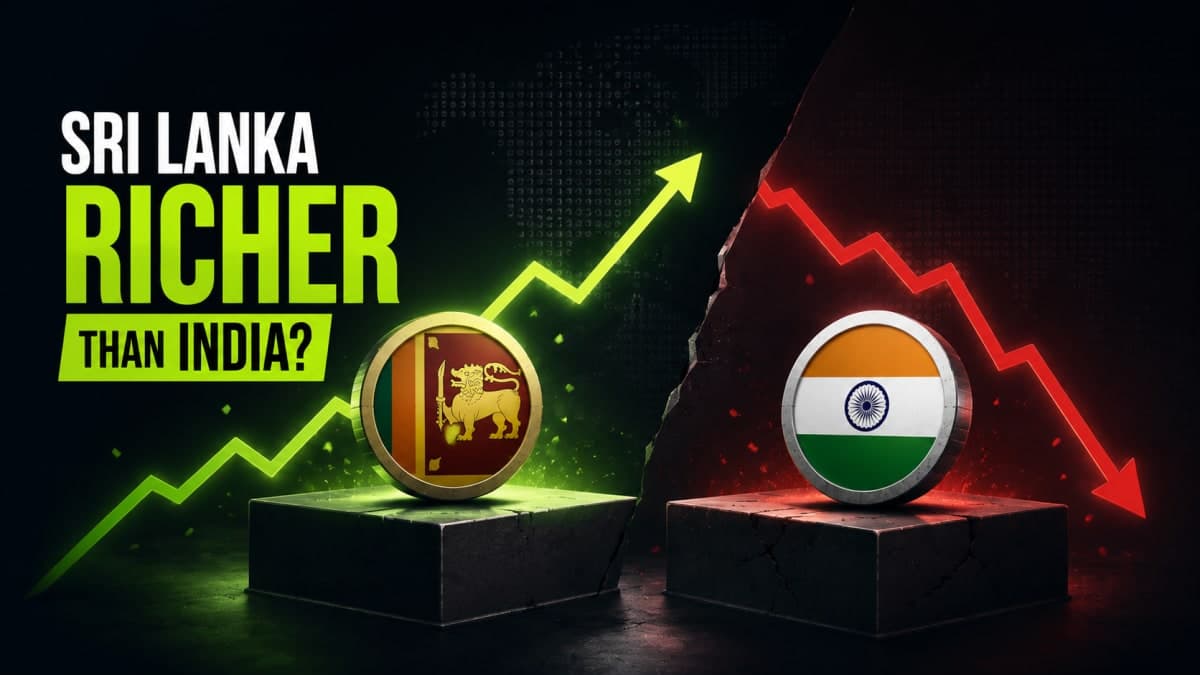
In today's FirstScroll, we break down how Sri Lanka just leapfrogged India in the World Bank's income rankings, and explain why that headline is quietly misleading.
This one's a fun one, because the answer flips halfway through. With that out of the way, let's dive into today's story.
The Story
Three years ago, Sri Lanka was the poster child for economic collapse. Petrol queues stretched for kilometres. Schools shut because there was no fuel to bus children in. The government ran out of dollars to import medicine, and in 2022 it did something a country almost never does: it stopped paying its foreign lenders altogether, defaulting on roughly $51 billion in foreign debt. Protesters stormed the president's residence and swam in his pool. It was, by any measure, rock bottom.
Now fast forward to July 2026.
The World Bank released its annual income classification, the list that sorts every economy on earth into four buckets: low, lower-middle, upper-middle, and high income. And Sri Lanka, the country that had defaulted three years earlier, got promoted. It jumped from lower-middle into the upper-middle-income club, alongside Jordan, the Philippines, and Vietnam.
India did not. India stayed exactly where it was, in the lower-middle bracket, one rung below its tiny neighbour.
So here's the question. How does a country that went bankrupt in 2022 end up "richer" than India, the fastest-growing major economy in the world?
You see, the trick is in what the World Bank actually measures. It doesn't rank countries by the size of their economy. If it did, India would win by a mile, because India's economy is more than 25 times larger than Sri Lanka's. Instead, the Bank uses something called GNI per capita, or gross national income divided by the population. GNI measures total resident income, wherever it is generated, then divides it by the population to get the average income per person.
And per person, the two countries aren't close. In 2025, Sri Lanka's GNI per capita hit $4,670, while India's sat at $2,760. The cutoff to enter the upper-middle bracket was $4,496. Sri Lanka scraped over the line, and the World Bank itself admitted the country crossed the threshold only narrowly.
Part of this is simple maths. Sri Lanka has about 22 million people. India has more than 1.4 billion. When your denominator is that enormous, even a fast-growing pie gets sliced very thin per person. India's economy can grow at a blistering pace, and it did, with GDP growth of 7.7% in FY26, and the average Indian still ends up with a far smaller slice than the average Sri Lankan.
The other part is Sri Lanka's rebound. Its real GDP grew 5% in 2025, driven by a recovery across industries and growth in financial and tourism services. Just as importantly, its currency stabilised and inflation cooled, and its Atlas GNI per capita rose 11.2%.
That word, Atlas, is where this gets interesting.
The World Bank doesn't just take today's exchange rate and convert everyone's income into dollars. It uses the Atlas method, which smooths exchange rate swings using a three-year moving average. The logic is sensible: it stops a single currency crash from making a country look dramatically poorer overnight, and it stops a sudden rebound from flattering it. So when Sri Lanka's rupee recovered after the crisis, the Atlas method fed that recovery back into the numbers.
But here's the twist.
The Atlas method converts income at market exchange rates, and market exchange rates say nothing about what money actually buys inside a country. The World Bank itself notes it doesn't account for purchasing power, that is, what people can buy with their income at home.
And once you switch to the measure that does account for that, purchasing power parity, the whole ranking inverts. On a PPP basis, India's average income is meaningfully higher than Sri Lanka's, not lower, because a rupee stretches further on Indian rents, food, and services than the exchange rate suggests. The "Sri Lanka is richer" headline holds only in the specific, exchange-rate-based lens the World Bank uses to hand out these labels.
Now to be clear, the classification isn't meaningless. It decides real things, like the terms on which a country can borrow from development lenders, and it's a genuine marker of Sri Lanka's recovery from the brink. The World Bank called it exactly that, a story of recovery. Crossing that line three years after a sovereign default is a real achievement.
So, is Sri Lanka actually richer than India now? On the one label that made the news, yes, narrowly, and mostly because 22 million is a much easier number to divide into than 1.4 billion. On the measure of what people can actually afford, no. Two countries reached the same rung of the ladder by walking in opposite directions: one clawing its way back up, the other quietly held down by the sheer weight of its own population. Whether India can convert its economic size into per-person income fast enough to climb a rung of its own is something only time will tell.
Until then…
If this story helped you make sense of the World Bank's income ladder, share it with a friend on WhatsApp, LinkedIn, or X.